Computing Podcast Stats with Elasticsearch
Friday, July 10, 2015, at 05:43PM
By Eric Richardson
Podcast stats at KPCC are generated via nginx, Logstash and Elasticsearch.
Since rejoining KPCC last fall, I've spent a good bit of time on the topics of metrics and analytics. There's a very healthy ecosystem of options for monitoring the traffic to your website or the health of your servers, but as a radio station we end up with a lot of questions around how our audio is getting consumed that don't always fit in those same tools.
Podcasts are the hot topic in the audio world right now, but they present a big challenge for those of us trying to make sense out of the numbers. Some of that challenge is intractable right now—podcast clients simply don't give us any information about when a downloaded file is played—but some of it is just about putting a better wrapper around old-school download stats.
At KPCC we're using two free tools—Logstash and Elasticsearch—to make it much quicker and easier to keep track of podcast downloads.
A few things to consider
Before you jump into setting up tools, it's important to understand a few characteristics of podcast downloads that you need to think about for metrics:
One download doesn't equal one request
Many podcast clients will use byte range requests to fetch a file in multiple requests. Some clients probe for the size first and then try to get it all via one followup request, while others simply divide the download into chunks, using one request per chunk. In the server's access log, these requests are typically represented via a status code of 206, or Partial Content. Other clients use a single request, and their response is given a status code of 200.
Either way, we want to make sure we count a single download one time.
Some requests may not equal downloads
In an ideal world, podcasters would be able to track and understand the number of times actual people listen to their content. Unfortunately, that's not how podcast clients work. They download files, which may or may not ever be listened to by the user. That's a reality we just sort of have to live with right now.
But not every request to a podcast file is even a client downloading audio. Some requests are from bots, others are from clients that like to inspect the beginning of a file but don't actually follow through with a download.
Broadly, we end up with specific requests we want to exclude (maybe via an IP blacklist), and requests that are too small to count.
Concepts
I'll get into the specifics, but basically there are two important concepts to our approach.
Session UUID
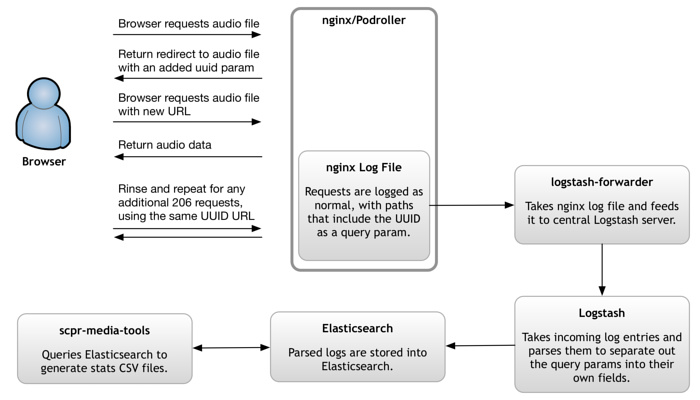
In order to easily deduplicate the pieces that make up one request, we inject a session UUID query parameter during the client's first request for audio content. We do this via a 302 Moved Temporarily response, which asks the browser to use the UUID URL for its download, but to try the original URL again next time it wants to access the same content.
If you aren't using a session or request ID of some sort, you end up needing to do the same deduplication manually during analysis by processing all your requests and looking for some unique combination of IP address, request path, user agent and time. You'll arrive in largely the same place, but the analysis script has to work much harder.
Elasticsearch Cardinality Aggregation
Once we've processed requests with the UUID injected above, we're able to then leverage Elasticsearch's cardinality aggregation to reliably estimate a number of unique sessions, without having to load all the session IDs into memory and count them.
Importantly, aggregations are something that Elasticsearch can do well across a cluster, meaning that your query can still perform well even as your number of requests and sessions scales.
The Specifics
nginx
The only important bit here is that you somehow inject the UUID. There are a million different ways you could do that. At KPCC, we use an old in-house tool called Podroller behind nginx for our audio delivery. It integrates with another old in-house system that serves up transcoded prerolls, which isn't relevant to this conversation. Because Podroller was sitting in the right place in our delivery pipeline, though, it was easy to add a step that takes any request that comes in without a uuid query param, generates one, adds it to the URL and redirects the user there.
If your audio delivery is via CDN, the redirect step may just need to be a light script that runs on a local server and redirects the altered URL to the CDN.
Logstash
We use logstash-forwarder to ship our nginx log files from the media server to our central Logstash server.
Once they get there, we use patterns matching our NGINX log file format and a Logstash filter to break each request into a number of fields:
After breaking the request log into all its fields (including, importantly, fields for the query parameters), Logstash outputs the results into Elasticsearch.
Elasticsearch
Here's where the fun happens. Now that all our data is in Elasticsearch, it's time for analysis.
I wrote a little Node.js tool called scpr-media-tools that we use for extracting Podcast stats. It ends up creating a rather lengthy JSON query body:
So what is it doing? It's filtering for:
- Requests that come from our audio delivery host and are marked as "podcasts" with a
viaquery parameter. The latter part wouldn't be necessary if podcast data is all you were piping into the system. - Requests that involved sending more than 8kb, which for us, this ended up being a suitable floor to filter out most of the non-requests mentioned above.
- Requests that match the day we're looking for, since our script grabs stats one day at a time.
- Requests that did not come from an IP address that we've blacklisted as a non-human scraper.
By saying size: 0, we're asking Elasticsearch not to return any actual data. Instead, we're asking for it to just return the output of two aggregations, one nested inside the other.
The show aggregation uses a context query parameter that we tag onto our URLs to break downloads out by program. If you've instead got well-named directories or files, you could pull them out via a Logstash filter and do the same thing here.
For each program, we then use the afore-linked cardinality aggregation to produce an estimated number of unique session UUIDs, using the uuid query parameter. The precision threshold tells Elasticsearch to manually count result counts under the threshold, but to do estimation above. Increasing that number will increase memory use, but reduce estimation error.
Once you've got your data to this point, you can also use Kibana to visualize it and build nifty dashboards:
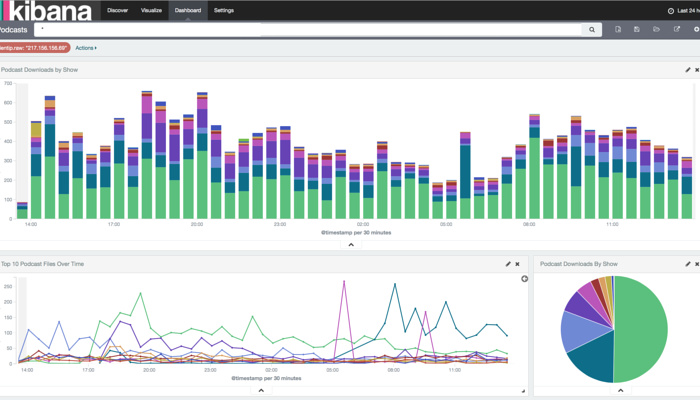
We have a couple different metrics pipelines for different types of audio delivery, but Elasticsearch aggregations have become the common denominator in all of them.